Visualizing Common 2D and 3D Geospatial Data in a Real-Time 3D Engine
Team
Paul Pernsteiner, Sven Liedtke (advisor)
Year
2021
Course
Bachelor thesis
Engine
Custom C++ DX11 engine, GDAL library
My focus
Converting and displaying multiple different geodata sources, smart multithreaded preloading ahead of current viewport, elevating ground and other layers based on dynamic heightmap
Geodata
There are multiple types of geospatial data in different local coordinate systems. GIS programs display several such data layers above each other usually in 2D by conversion between them. They also allow manipulation of the available data. In addition to point, line or area data, certain formats allow 3D objects in form of buildings in different levels of detail (LoD) or even laser scanned colored point clouds.
Engine
The pre-existing DX11 rendering engine written in C++ was orinially not able to create new objects at runtime, which is a basic requirement for loading any kind of displayable data at runtime. Since data conversion and mostly the triangulation algorithm to create mesh representation of any planar geodata shape require an unknown duration, a task scheduler was implemented that synchronizes the result with the main thread after finishing.
This is due to many data formats (such as CityGML) being human-readable, which bloats the file sizes and increases the spatial filtering duration for obtaining only the data inside a given region from previously downloaded regions instead of optimized databases.
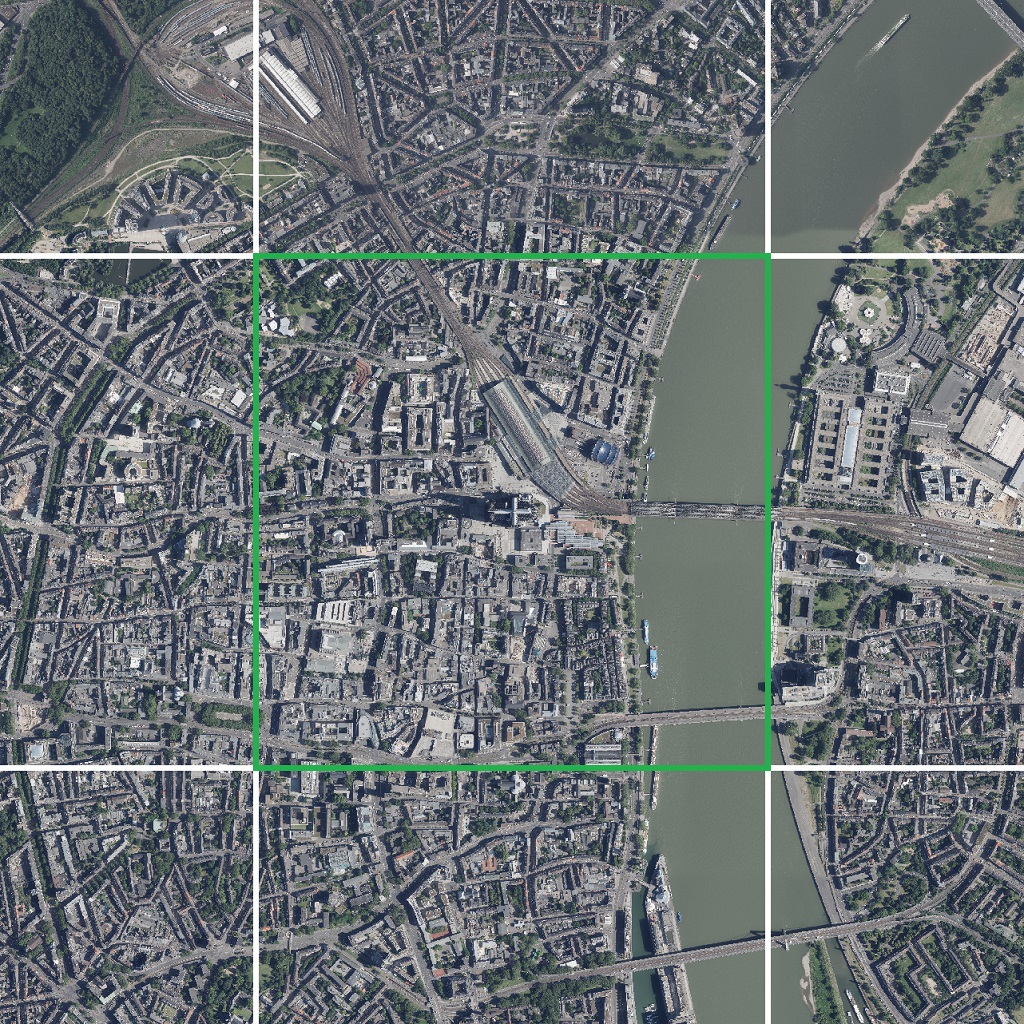
Preloading Data
To increase responsiveness and reduce web traffic, 2D layers are loaded with an area larger than currently visible (green). This allows for pan and zoom in a certain window without requesting an updated image. While also being possible for 3D layers, the current approach easily reaches the draw call limit for reasonable FPS of the engine.
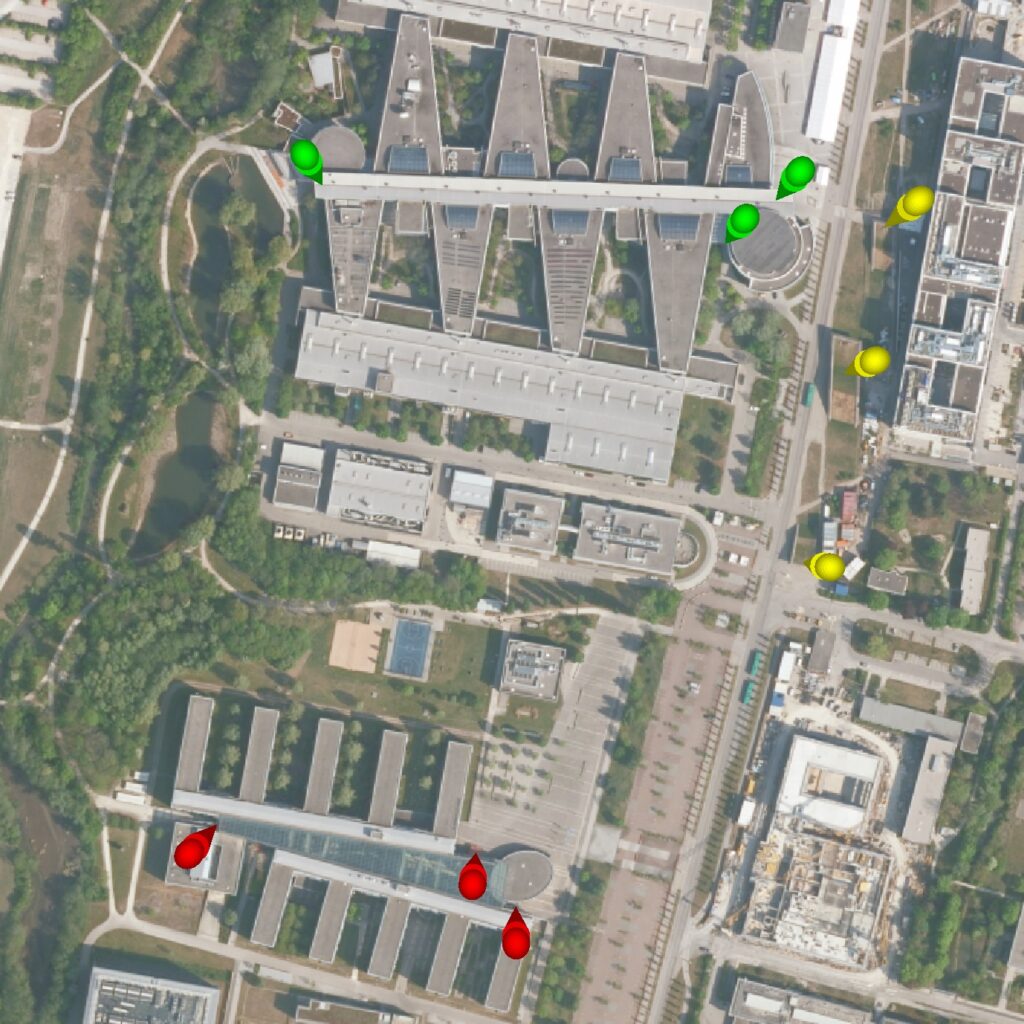
Special Data
Custom and optionally textured meshes can be loaded at point-based geodata sources. The used library supports a specially formatted filter string (similar to WHERE in SQL) to select a subset based on attributes. In this case 3 layers of the same custom data source are displayed, filtering for different points and being displayed in different colors (at the TUM Garching campus).
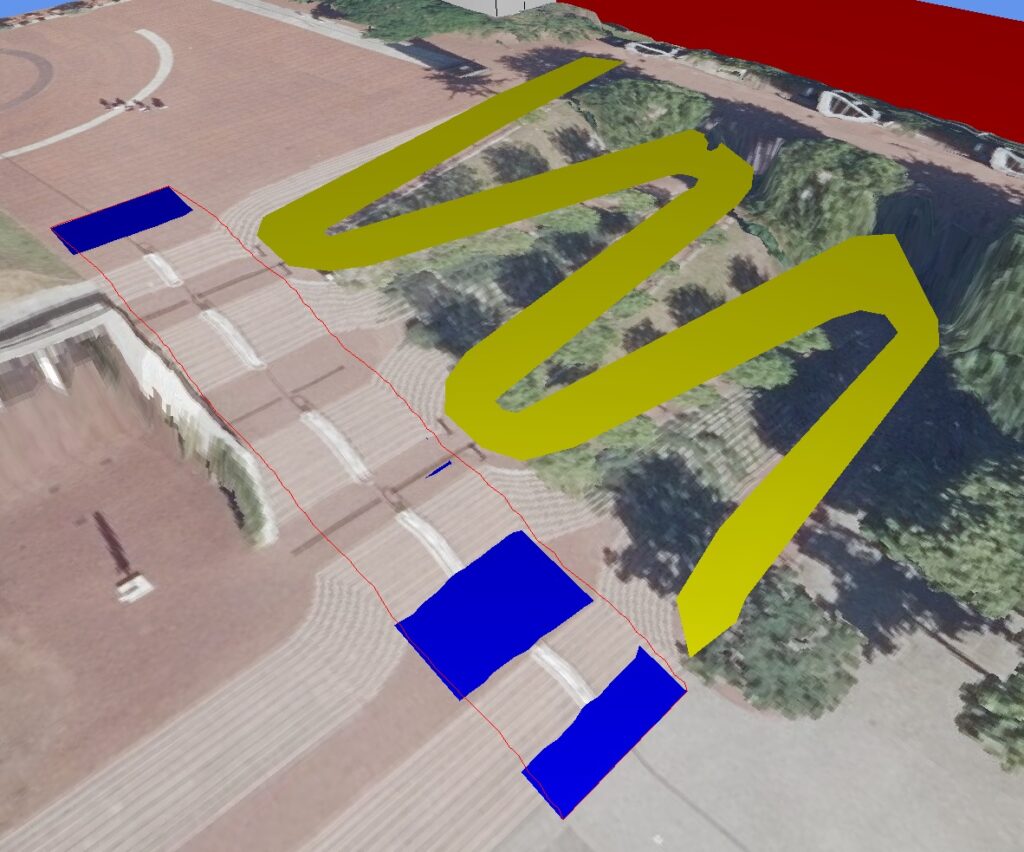
Height Data
Since there are elevation maps with accurate heights in meters, these can be used to elevate other layers if specified by the current config. For 2D maps, a mesh with multiple quads is used to sample the height map. For other data types, the source points are moved individually by the shader, which requires external preprocessing workflows if visual errors need to be corrected (blue quad only 4 points, red line two points per meter and slightly manually elevated).